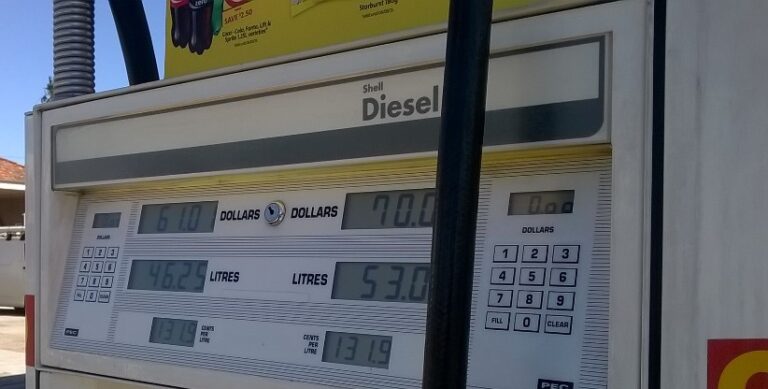
Working out annual fuel budgets can feel like guess work even with the most reliable forecasts. To help with this process, and also for a trip down memory lane, Fleet Auto News has sourced historical pump prices on petrol and diesel in each state from the Australian Institute of Petroleum website.
Average ULP Pump Prices
| NSW | VIC | QLD | SA | WA | NT | TAS | National | |
| 2002 | 88.4 | 87.7 | 80.9 | 88.5 | 90.9 | 96.6 | 92.6 | 87.3 |
| 2003 | 92.2 | 89.9 | 83.8 | 92.1 | 93.7 | 100.6 | 96.0 | 90.4 |
| 2004 | 100.2 | 98.2 | 91.5 | 99.8 | 100.0 | 107.7 | 104.6 | 98.2 |
| 2005 | 113.9 | 111.8 | 104.9 | 114.0 | 112.7 | 120.4 | 117.9 | 111.8 |
| 2006 | 126.8 | 126.0 | 119.7 | 126.7 | 126.1 | 134.7 | 129.9 | 125.3 |
| 2007 | 126.8 | 126.0 | 120.3 | 126.1 | 127.0 | 136.8 | 129.5 | 125.4 |
| 2008 | 143.8 | 143.4 | 136.7 | 143.1 | 143.3 | 154.8 | 149.3 | 142.4 |
| 2009 | 120.7 | 121.3 | 117.6 | 120.2 | 119.2 | 128.9 | 124.2 | 120.3 |
| 2010 | 125.7 | 125.8 | 127.2 | 125.1 | 127.0 | 134.9 | 132.1 | 126.3 |
| 2011 | 140.9 | 139.8 | 142.2 | 140.3 | 142.0 | 151.3 | 147.0 | 141.2 |
| 2012 | 141.4 | 140.7 | 145.6 | 141.8 | 143.0 | 157.6 | 150.8 | 144.3 |
| 2013 | 148.0 | 145.4 | 149.6 | 146.0 | 148.1 | 166.3 | 158.2 | 147.9 |
| 2014 | 149.0 | 145.7 | 151.0 | 146.4 | 149.6 | 170.4 | 158.9 | 148.8 |
| 2015 | 130.4 | 126.3 | 131.8 | 127.6 | 130.2 | 134.3 | 137 | 129.6 |
| 2016 | 117.6 | 116.4 | 119.8 | 114.6 | 118.3 | 121.3 | 123.2 | 117.8 |
| 2017 | 128.3 | 128.7 | 131.1 | 126.9 | 129.6 | 137.8 | 139.5 | 129.3 |
| 2018 | 143.6 | 143.4 | 145.3 | 141.6 | 144.9 | 160.4 | 154.7 | 144.3 |
| 2019 | 141.1 | 141.1 | 142.8 | 142.7 | 141.8 | 151.4 | 150.7 | 142 |
| 2020 | 123.2 | 123.9 | 124.5 | 120.7 | 120.8 | 134.7 | 131.0 | 123.4 |
| 2021 | 148.7 | 147.6 | 148.9 | 142.8 | 146 | 155.2 | 150.7 | 147.8 |
| 2022 | 184.9 | 184.3 | 184.4 | 179.7 | 181.9 | 199 | 191.9 | 184.2 |
| 2023 | 190.9 | 189.7 | 191.2 | 186.3 | 185.4 | 201 | 192.7 | 189.8 |
| 2024 | 190.2 | 188.7 | 192 | 183.3 | 182.4 | 197.8 | 189.1 | 188.8 |
Average Diesel Pump Prices
| NSW | VIC | QLD | SA | WA | NT | TAS | National | |
| 2007 | 134.7 | 129.8 | 124.7 | 133.1 | 135.9 | 139.1 | 135.4 | 131.3 |
| 2008 | 164.3 | 160.3 | 154.9 | 163.1 | 166.7 | 171.1 | 168.1 | 161.6 |
| 2009 | 123.3 | 119.8 | 119.4 | 122.1 | 127.3 | 132.2 | 128.4 | 122.5 |
| 2010 | 130.3 | 126.5 | 129.6 | 129.1 | 133.3 | 139.3 | 134.1 | 130.1 |
| 2011 | 148.9 | 145.1 | 148.3 | 148.2 | 150.8 | 159.0 | 152.6 | 148.5 |
| 2012 | 147.9 | 146.2 | 149.3 | 149.5 | 150.5 | 158.6 | 155.1 | 150.6 |
| 2013 | 154.1 | 151.2 | 154.4 | 154.4 | 156.3 | 168.4 | 159.6 | 154.3 |
| 2014 | 156.8 | 153.1 | 156.6 | 155.9 | 159.7 | 172.6 | 164.2 | 156.8 |
| 2015 | 130.1 | 125.9 | 131.1 | 128.2 | 134.9 | 138.2 | 137.8 | 130.4 |
| 2016 | 117.8 | 116.2 | 118.9 | 116.4 | 121.6 | 123.3 | 122.8 | 118.5 |
| 2017 | 128.5 | 128.3 | 129.5 | 127.1 | 132.3 | 135.1 | 136.4 | 129.6 |
| 2018 | 148.9 | 148.8 | 148.7 | 147.6 | 152.8 | 164.8 | 156.9 | 149.8 |
| 2019 | 147.9 | 146 | 147.1 | 147.9 | 148.9 | 161.4 | 158.8 | 148 |
| 2020 | 126.3 | 126.2 | 125.7 | 125.7 | 127.3 | 142.1 | 139.0 | 126.9 |
| 2021 | 142.9 | 142.6 | 142.5 | 142.2 | 142.1 | 157.2 | 149.2 | 143 |
| 2022 | 207.7 | 207.5 | 208.3 | 205.9 | 203.8 | 222 | 213.2 | 207.5 |
| 2023 | 202.5 | 202 | 202.9 | 198.6 | 197.5 | 225 | 208 | 202 |
| 2024 | 191.8 | 191.7 | 192.2 | 188.6 | 187.3 | 210.8 | 194.3 | 191.4 |
The prices listed in the tables above are the average retail pump prices including GST.
For more information visit www.aip.com.au


