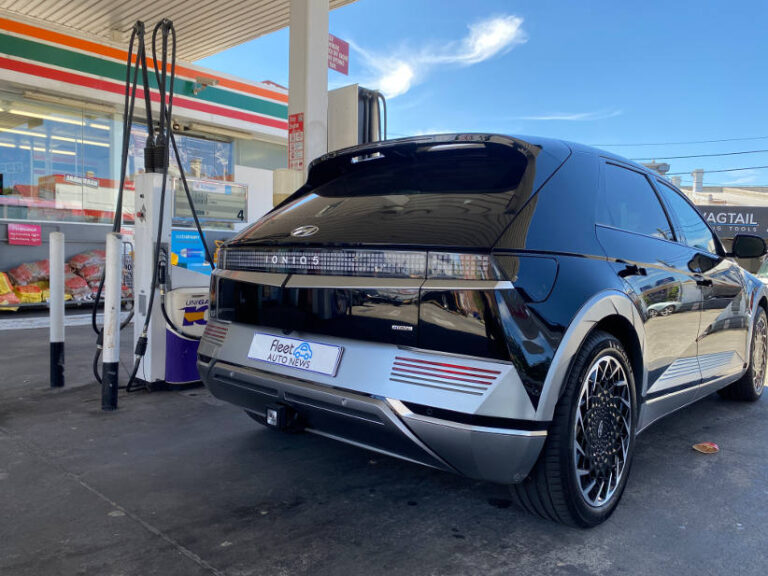
When you calculate the Whole of Life Cost for a fleet vehicle, or even a budget for a novated lease, fuel is one of several variable components that can be tricky to estimate. You need to consider the type of vehicle, annual kilometres and pump prices. Then if the driver of the vehicle changes, so does the total cost of fuel for the year.
Electric vehicles will not eliminate this issue though the calculations may get more complex when you have a combination of renewable and coal based electricity sources.
The tables below show the changes in average national pump prices for ULP and Diesel over several years. You can find data on earlier years here.
In previous years the fluctuating prices for diesel could be used to predict the sales of diesel powered cars the following years. Low diesel prices compared to ULP would increase sales. Low ULP prices meant fewer diesel new car sales.
This was back in a period of time when fuel standards were changing and small cars were still popular with consumers. Now the market seems settled on what models should be diesel, petrol or hybrid and there’s no option to choose another power source. This will change again over the next 10 years as more electric, PHEV and hydrogen powered cars are launched in Australia
Average ULP Pump Prices
| National Average (cpl) | Change | |
| 2017 | 129.3 | |
| 2018 | 144.3 | 12% |
| 2019 | 142 | -2% |
| 2020 | 123.4 | -13% |
| 2021 | 147.8 | 20% |
Average Diesel Pump Prices
| National Average (cpl) | Change | |
| 2017 | 129.6 | |
| 2018 | 149.8 | 16% |
| 2019 | 148 | -1% |
| 2020 | 126.9 | -14% |
| 2021 | 143 | 13% |


