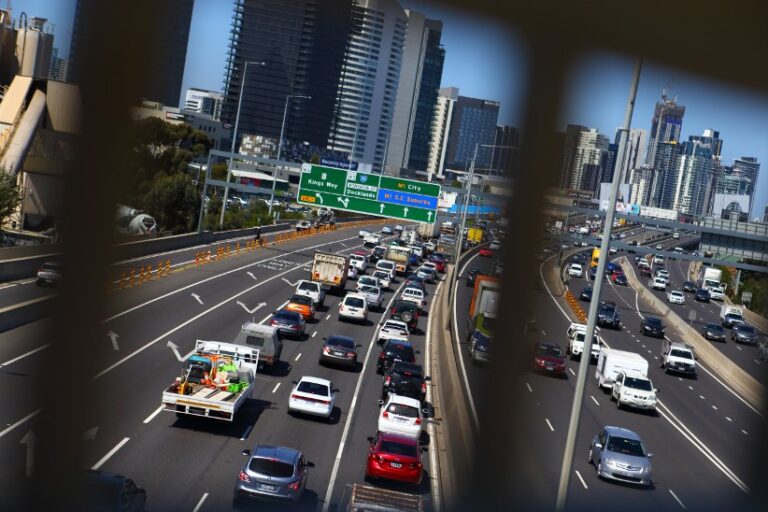
In 2017 there was another record broken for new car sales. This was the fourth record in five years so there should be more vehicles than ever on Australian roads – until you minus the ones that are involved in accidents or reach their due date.
This table is from the Australian vehicle census released in January 2017. It shows the total number of registered vehicles in each state.
| 2011 | 2015 | 2016 | |
| New South Wales | 4,778,421 | 5,247,199 | 5,374,419 |
| Victoria | 4,198,371 | 4,567,314 | 4,681,337 |
| Queensland | 3,401,932 | 3,771,321 | 3,854,205 |
| South Australia | 1,261,925 | 1,347,514 | 1,364,700 |
| Western Australia | 1,912,739 | 2,185,409 | 2,208,812 |
| Tasmania | 419,009 | 450,403 | 457,629 |
| Northern Territory | 137,082 | 155,035 | 157,717 |
| Australian Capital Territory | 258,904 | 283,572 | 288,317 |
| Total Australia | 16,368,383 | 18,007,767 | 18,387,136 |
| 2011 | 2015 | 2016 | |
| Passenger Vehicles | 12,474,044 | 13,549,449 | 13,815,107 |
| Light Commercial Vehicles | 2,530,630 | 2,907,006 | 2,985,592 |
| Light Rigid Trucks | 119,539 | 140,625 | 145,426 |
| Heavy Rigid Trucks | 318,223 | 331,699 | 334,812 |
| Articulated Trucks | 85,965 | 94,975 | 96,185 |
| Buses | 87,883 | 95,149 | 96,582 |
Source: abs.gov.au


